Song Visualization: Working at Perfekt
March 1, 2016
Can you study a song’s structure without ever hearing it? Indeed you can. By using different methods to visualize the audio in a song, one can see not only which sections are quiet or loud, but also differentiate between the sonic textures in different sections.
The video above shows the song structure of Working at Perfekt, my favorite song from Geddy Lee’s solo album My Favorite Headache. Interestingly, it was created entirely without listening to the song! In this post, I’ll explore different ways to visualize music, one of which (shown in the video above) allows you to see a song’s structure at a glance without even hearing it.
For the first song visualization, here’s the song’s waveform.
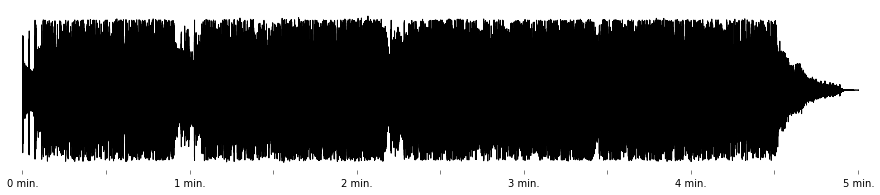
It’s clear there are two quiet sections at around 1:00 and 2:10, but it’s difficult to see much else. Sound amplitude might be more informative. Raw and smoothed amplitude are shown below.
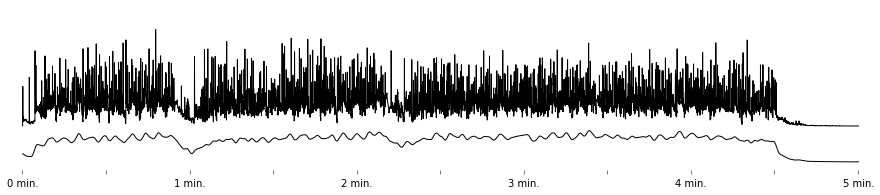
This view shows some variation that was hidden in the waveform, but it’s not enough to get a clear picture of where one section ends and another begins. I’ll try the spectrogram next, which plots the strength of various frequencies over time.
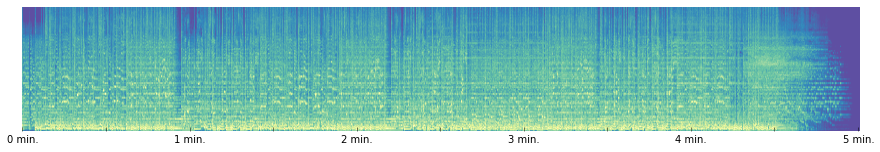
Now we can finally see some of the song’s finer structure. The lower frequencies from the drums and bass are clumped together at the bottom, while the higher frequencies of the voice are around the middle. The sharp vertical lines are drum hits that span the frequency spectrum from low to high. Now, in addition to the quiet points we could see earlier, there are regions which seem more or less dense, like from 0:35 to 0:50, for instance. This section looks similar to the one centered on 2:00.
In any case, I expect there are still better visualizations of song structure, like the chromagram below, which plots the strength of the 12 chromatic notes instead of raw frequencies.
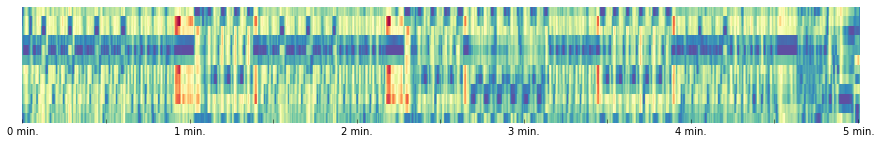
This provides a much clearer view of the song, as it’s basically a simplified form of standard musical notation. Though this is probably sufficient for segmenting a song, there are still a few other options to explore. The next image compares each beat in the song to every other.
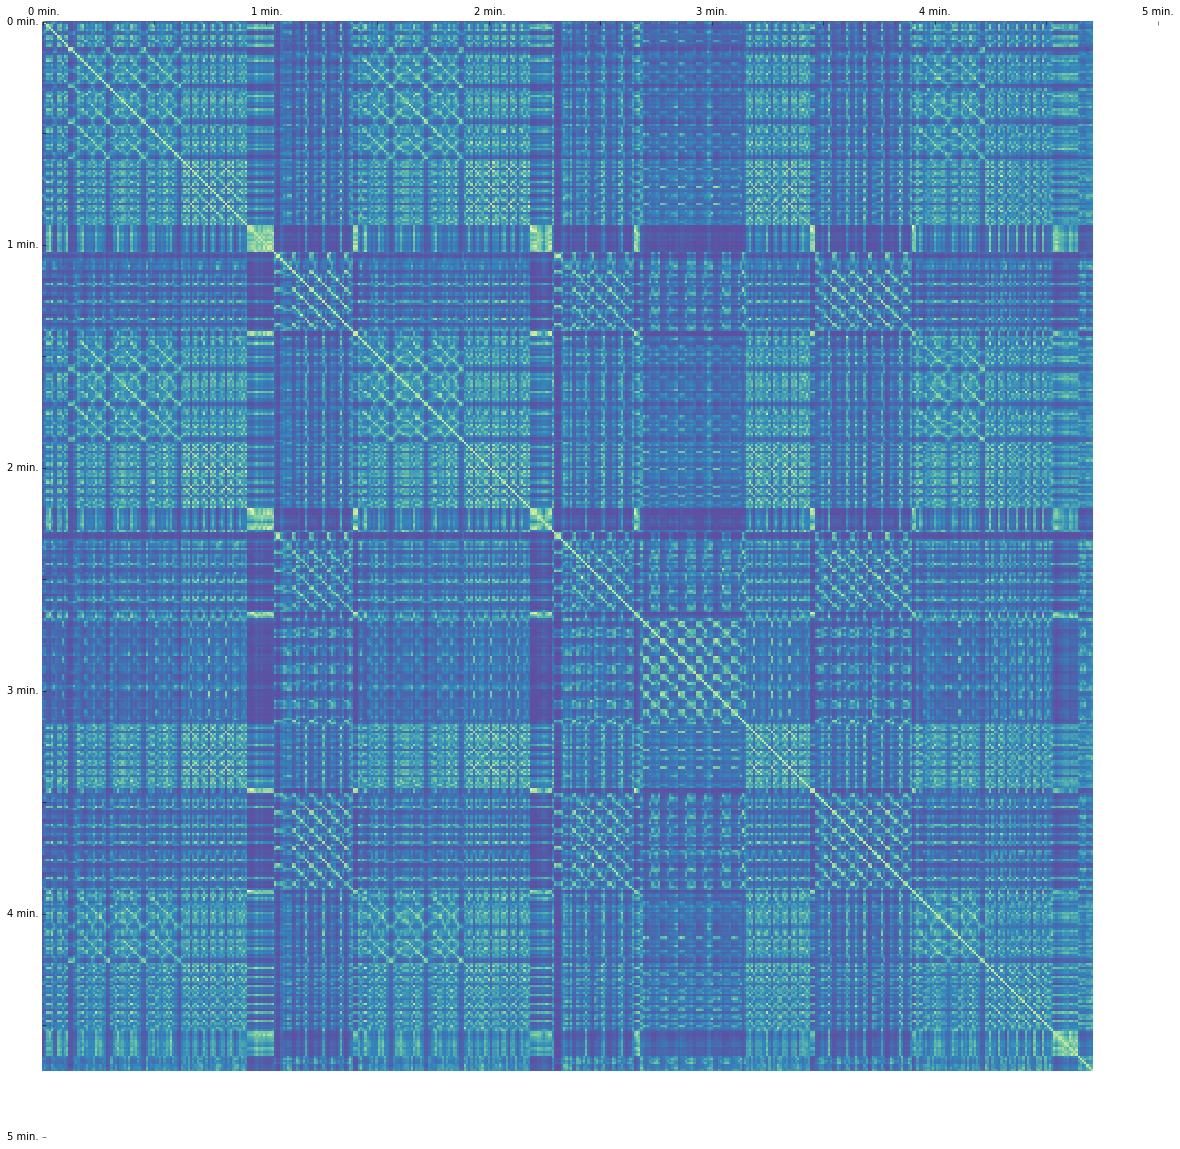
Bright spots indicate beats that are similar. Each beat is compared to itself along the diagonal from the top left to the bottom right. These points are the brightest as a result. To compare two points, at 2:00 and 3:00, say, you’d travel along the x-axis to 2:00 and then down the y-axis to 3:00. The plot is symmetric (since order doesn’t matter in this comparison), so you could also find the same thing by going down the y-axis to 2:00 and then right along the x-axis to 3:00. Since this plot repeats every comparison twice, it can be split in half without losing any information - as shown below.

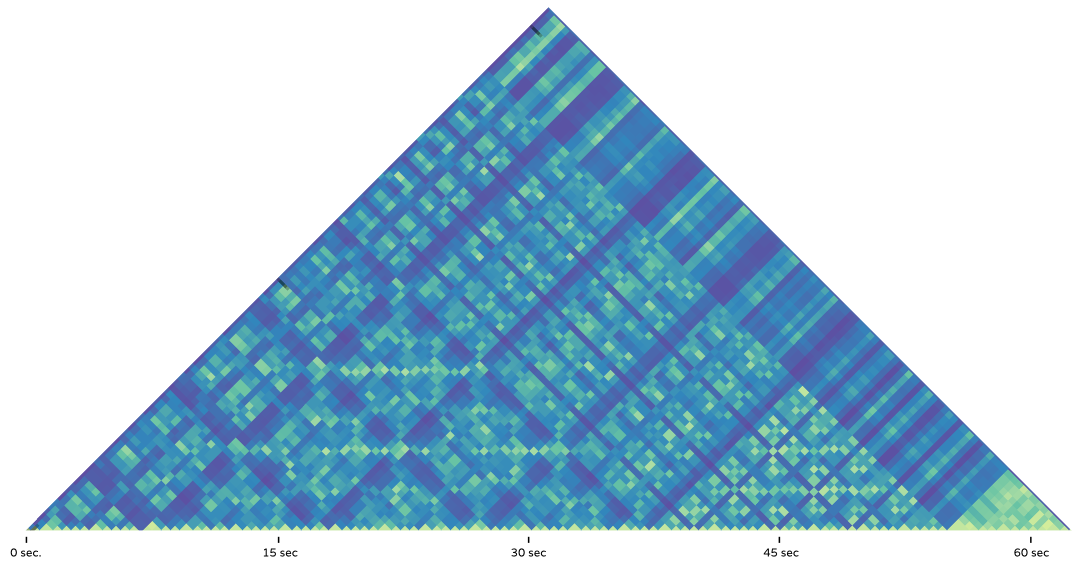
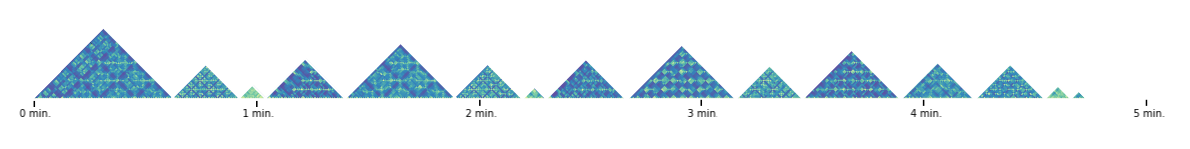
There’s plenty of information here, but the bottom of the figure seems most informative. This is where moments are compared to their immediate neighbors. For the first thirty seconds of the song (bottom left), there’s a triangular patch with a repeating pattern. Then, the pattern changes - though there’s still structure there. Let me zoom in on that.
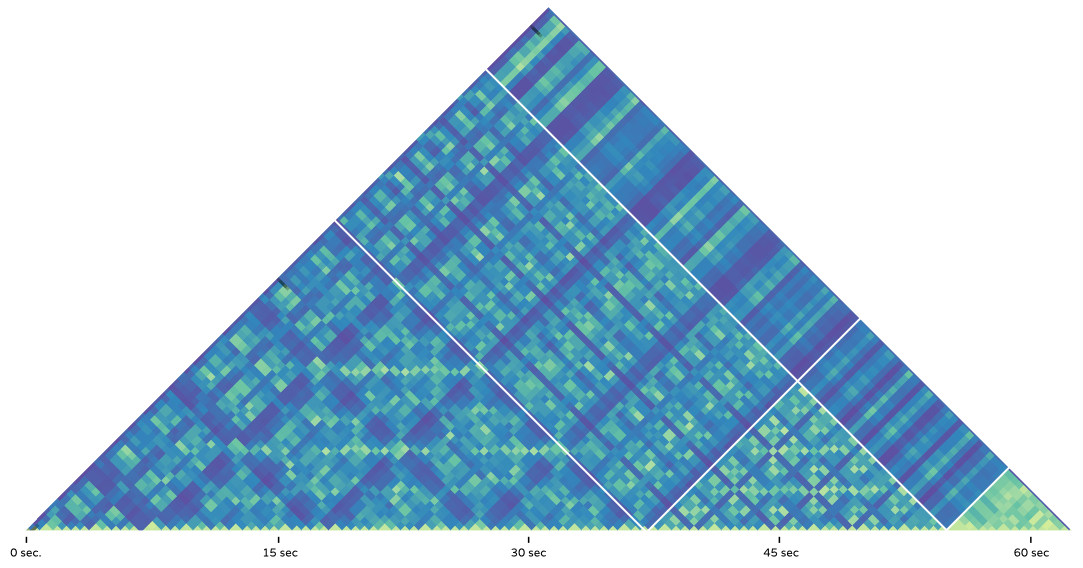
After seeing these patterns in detail, I feel pretty confident in separating one section from another. Below, I’ve drawn borders around the sections I think are distinct.
I can also do the same for the entire song.
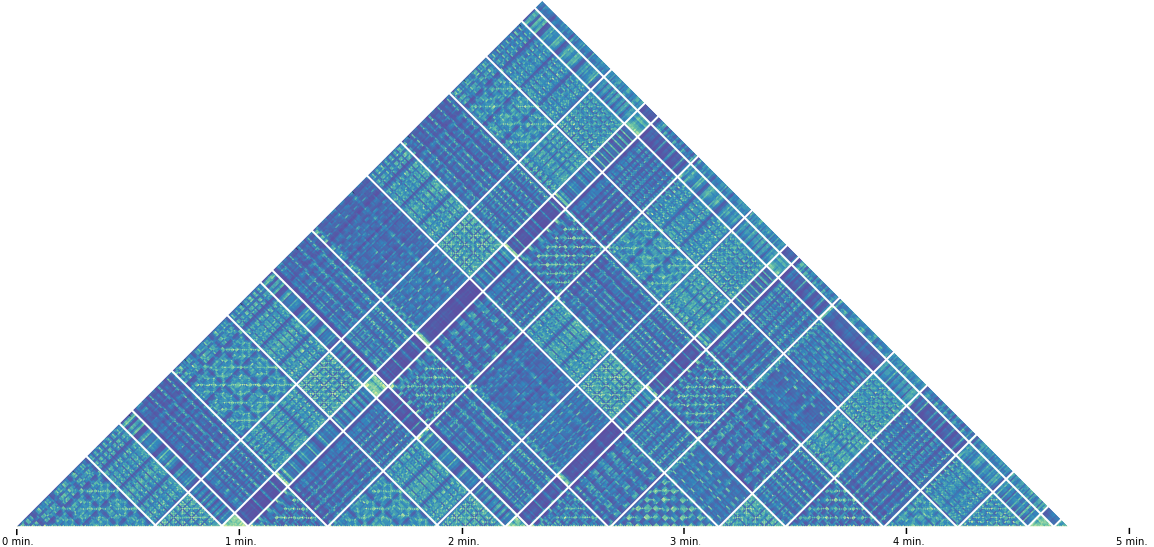
I think the bottom triangles are most interesting, so I’ll ignore everything else.
Now that I’ve turned the song into a few patterned triangles, it’s fairly easy to see which sections are which. I’ll label them below.
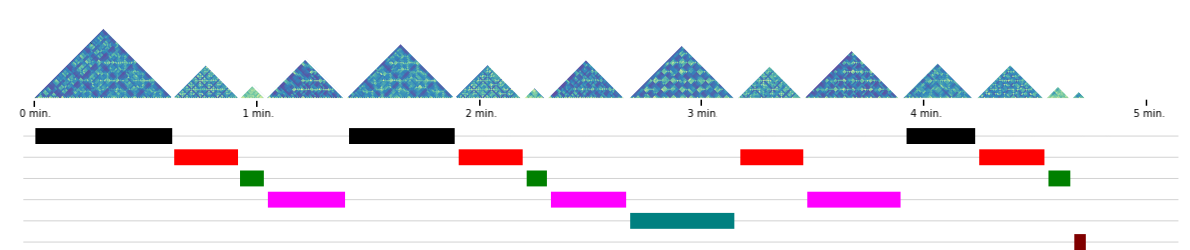
For anyone trying to cover this song, it looks like there are around 5 or 6 distinct parts to this song, though some of these are fairly short. There are really only 4 distinct parts of reasonable length - the ones shown in black, red, purple, and turquoise. The black section occurs 3 times, the red section 4 times, the purple 3 times, and the turquoise section only once.
This sort of analysis is a nice first step in looking at song structure, though there are plenty of improvements to make, and many more musical questions to answer!
Problems with this analysis
It’s useful to point out areas for expansion or improvement for the future, so here are a few problems and opportunities.
- This post only looks at global structure, but doesn’t explain what’s good about the song or why anyone should like it.
- Only large patterns were considered. There are many small patterns too - within a chorus or solo, say.
- It’s hard to comment on a piece of music without listening to it. It would be great to have a closer connection with text and audio. Perhaps a video is better for this purpose, because commentary can be alternated with the song itself.
- Transitions between sections were found manually. This might be automated. Audio segmentation is a well-researched problem.
- Transitions are interesting in their own right. How are different sections connected?
- I should post a short explanation of the code involved.
- The different views of the song should be put near each other so you can see how sections are represented in each image.
- I looked only at the connections between beats that were near each other. I could also do this for beats that are farther apart. This helps to show repetitions of a particular section throughout the song.
- The beat-finding algorithm was used to segment the data into small chunks, but, since no beats were found at the end of the song (because there literally weren’t any drum beats), that data is missing entirely. I could fix this so data is available for the whole song.
- The line separating one section and another is slightly arbitrary. There are often transition periods that sound different from the sections they connect, but they’re lumped into one or the other to avoid having many short sections.
- I manually matched sections that were similar. This could be automated.